![]() Editor’s Note: Jeremy B. Landa, Neag School doctoral student in the Learning, Leadership, and Educational Policy program, prepared the following issue brief — in affiliation with the Center for Education Policy Analysis (CEPA) — exploring the distribution of Black or Hispanic educators across Connecticut’s school districts.
Editor’s Note: Jeremy B. Landa, Neag School doctoral student in the Learning, Leadership, and Educational Policy program, prepared the following issue brief — in affiliation with the Center for Education Policy Analysis (CEPA) — exploring the distribution of Black or Hispanic educators across Connecticut’s school districts.
In 2012, enrollment of Black or Hispanic students stood at 40.0% of the total student population in U.S. public schools.1 However, Black or Hispanic educators comprise just 15.5% of all public school teachers and 18.8% of all principals.ii The stark underrepresentation of Black or Hispanic educators2 has important implications for students who can benefit from having educators who share their racial identity. Moreover, this discrepancy may be even more pronounced at the local level than these national statistics suggest.
In 2012, enrollment of Black or Hispanic students stood at 40.0% of the total student population in U.S. public schools. However, Black or Hispanic educators comprise just 15.5% of all public school teachers and 18.8% of all principals.
This policy brief presents data on the racial composition of the educator workforce across Connecticut school districts. Statewide data show that:
- Nearly one-quarter (44 of 201) of school districts in Connecticut employed no Black or Hispanic educators in the 2015-2016 school year,
- Almost two-thirds (129 of 201) of school districts in Connecticut employed between zero and one Black or Hispanic educator for every ten positions,
- Just over one-tenth (28 of 201) of school districts in Connecticut employed between one and four Black or Hispanic educators for every ten positions,
- Black or Hispanic students attend schools in all school districts in the state,
- Black or Hispanic student to educator ratios were lowest in mid-sized urban school districts, and
- The number of Black educators in mid-sized urban school districts drove these ratios.
Based on these findings, I offer research-based recommendations for state policymakers, superintendents, human resource (HR) directors, and principals.
Why Does Teacher Diversity Matter?
Simply put, teachers of color make a difference in all students’ lives. Students taught by teachers of the same race perform better on math and reading testsiii and are less likely to be absent or suspended.iv Gains in test scores and long-term outcomesv are greater for Black students with Black, rather than White, teachers in early elementary school grades.vi While the benefits may concentrate for Black or Hispanic students,vii all students may benefit from working with Black and Hispanic teachers whom students tend to view more favorably than White teachers.viii
What explains these outcomes? In classrooms, teachers may perceive students who share their race to be more attentive, less disruptive, and more engaged in homework than students of other races.ix Teachers assess students who share their race more favorably than teachers whose students do not share their race.x At the school level, students with same-race teachers are more likely to receive access to gifted and talented reading instruction than students with different-race teachers.xi Which Black or Hispanic students are most likely be exposed to educators who share their racial identity?
Where Do Black or Hispanic Licensed Educators Work in the U.S.?
Research using national data finds that most Black or Hispanic educators work in urban districts with high percentages of students of color. Nationally, Black or Hispanic teachers account for about a quarter of the teachers in schools in urban locations, and 46% of the teachers in schools with over 90% students of color.xii Furthermore, Black or Hispanic principals account for 32.5% of all principals in urban schools.xiii These data suggest that when it comes to the distribution of the educator workforce, place and race are related.
One study shows similar clustering of teachers of color within one state. A 2018 inquiry in Pennsylvania found only a few districts employed most teachers of color. Only 15 of 499 (3%) districts were more than 8% teachers of color, while 190 (38%) districts employed no teachers of color.xiv Teachers of color were most prevalent in Philadelphia and Pittsburgh and nearby districts. While this study suggests that urban locations are the most likely place of employment for Black or Hispanic educators, other states may have the same demographic, geographic, or education systems.
Teacher by Race in Connecticut
Connecticut is the sixth-most densely populated state in the country, and third-smallest in land area.xv The state has a well-documented history of residential and school segregation, which political and legal actions have attempted to remedy.xvi As of 2015-16, Connecticut school districts served approximately 500,000 students with 42,000 teachers.xvii The average district served 11% more students of color in 2016 than in 19873, and 10% of this increase is the result of more Hispanic students attending public schools.xviii And yet, as of 2015, Connecticut’s Black educator workforce stood at 3.4% and Hispanic educator workforce at 3.5% of all teachers, and neither figure has changed by more than one percentage point in the last 15 years.xix
Where Do Connecticut’s Black or Hispanic Licensed Educators Work?4
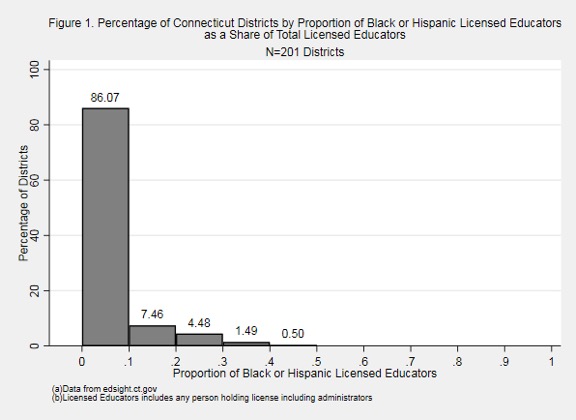
Black or Hispanic educators were scarce or absent from most districts. In 2015-16, Black or Hispanic educators were absent or underrepresented in nearly nine out of every 10 districts in Connecticut. Figure 1 illustrates the number of districts with the proportion of Black or Hispanic educators in 0.10, or 10% increments. In total, 173 of 201 districts employed Black or Hispanic educators as no more than 10% (<0.10) of their total educator workforce. Of the 173 districts that employed Black or Hispanic educators as less than 10% of their staff, 44 employed no Black or Hispanic educators, nine employed only Black educators, 46 only Hispanic educators, and 74 employed a combination of Black or Hispanic educators. In sum, these districts employed very few, if any, Black or Hispanic educators.
Black or Hispanic educators were clustered in a few districts. Black or Hispanic educators were more prevalent in 28 districts in Connecticut (Figure 1). In 15 of the districts, between 10 and 20% (0.10 to 0.20) of educators were Black or Hispanic; in the remaining 13 districts, 20 to 40% (0.20 to 0.40) of educators were Black or Hispanic. Of the 28 districts that employed Black or Hispanic educators as more than 10% of their staff, 25 employed a combination of Black or Hispanic educators, two employed only Black educators, and one employed only Hispanic educators.
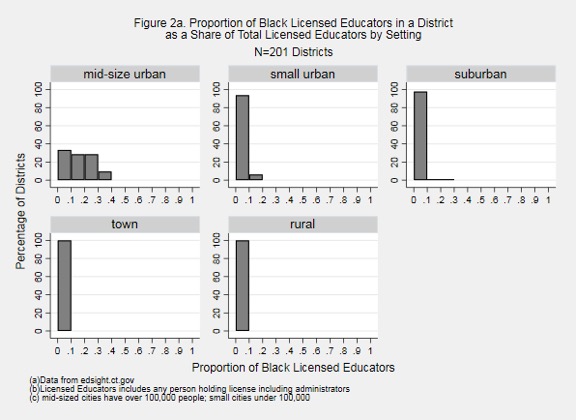
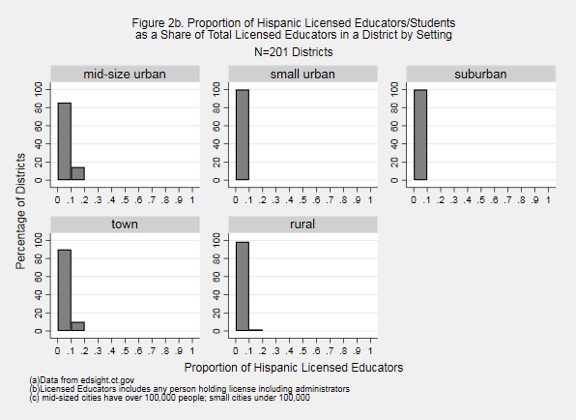
Black educators clustered in mid-sized cities; Hispanic educators were scarce everywhere. When the analysis accounted for district urbanicity, it became evident that Black or Hispanic educators worked in districts located in mid-sized urban locations most often, and all other locations less frequently. Figure 2a and Figure 2b display five figures representing the percentage of districts that have a proportion of Black or Hispanic educators in 0.10 increments. Black educators were represented in greater numbers in mid-sized districts in Connecticut. About two-thirds, or 14 of 21, mid-sized urban districts employed more than 10% Black educators. Conversely, only 6%, or 11 of 180, districts located in small urban, suburban, town or rural settings had more than 10% Black educators. In contrast to Black educators, Hispanic educators were poorly represented regardless of district urbanicity. In total, 2% of all districts, or four of 201, employed more than 10% Hispanic educators. This evidence suggests that Black educators cluster in mid-sized city districts while Hispanic educators are evenly spread out, but sparsely represented, across all districts.
Simply put, teachers of color make a difference in all students’ lives. Students taught by teachers of the same race perform better on math and reading tests and are less likely to be absent or suspended. Gains in test scores and long-term outcomes are greater for Black students with Black, rather than White, teachers in early elementary school grades.
What is the ratio of Black or Hispanic students to licensed educators in CT?
This analysis has shown that Black or Hispanic teachers cluster in mid-sized cities, but perhaps a more important question is where Black or Hispanic educators are found in relation to Black or Hispanic students.
The racial composition of school districts varies widely, but is non-zero everywhere. Across all of Connecticut’s school districts, the median district consisted of 11.2% Black or Hispanic students (Table 1). At the high end, mid-sized urban districts median enrollment is 93.8% Black or Hispanic students. The median percentage of Black or Hispanic students is largest in small urban districts (51.8%) and much smaller in suburban (11.8%), town (11.4%), or rural (6.5%) districts.
District ratios of Black or Hispanic students to educators are large and vary considerably. The median district in Connecticut has a ratio of 61 Black or Hispanic students for each Black or Hispanic educator (Table 2). The maximum ratio in a district, excluding the 44 districts with no Black or Hispanic educators, is 359 Black or Hispanic students for each Black and Hispanic educator. The minimum ratio is 3 Black or Hispanic students for each educator. With many Black or Hispanic students and few Black or Hispanic educators, most students in Connecticut have a low probability of interacting with a Black or Hispanic educator.5
Student-to-educator ratios are smallest in mid-sized urban districts, but acute everywhere. Districts located in urban, suburban, and rural locations varied in terms of the ratio of Black or Hispanic students to educators. The median mid-sized urban district had a ratio of 46 Black or Hispanic students for each Black or Hispanic educator (see Table 2). The median districts located in small urban, suburban, town, and rural locations had ratios that were greater than mid-sized urban districts, ranging from 56:1 to 189:1. Even in the best of circumstances, there are nearly 50 Black or Hispanic students for each Black or Hispanic educator.
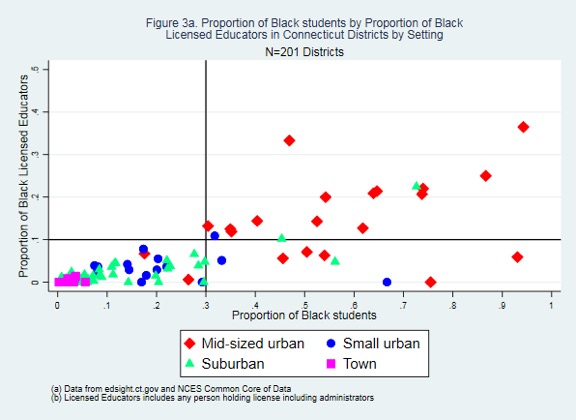
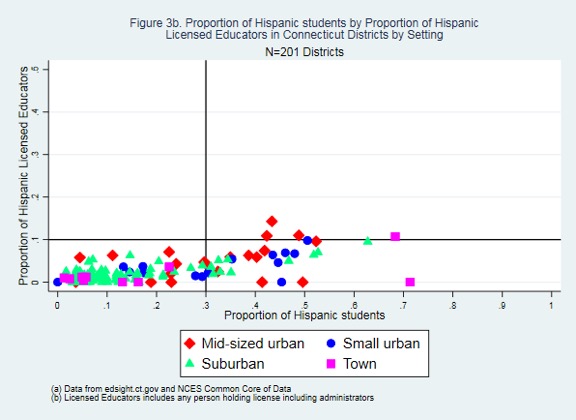
Student-to-educator ratios are driven by Black educators in mid-sized cities. Figure 3a shows that over 90% (19 of 21) of mid-sized urban districts identified Black students as more than 30% of their students and 67% (14 of 21) identified Black educators as more than 10% of their educators. Figure 3b shows that 57% (12 of 21) of mid-sized urban districts educated Hispanic students as more than 30% of their students and 14% (three of 21) employed Hispanic educators as more than 10% of their educators. This analysis clarifies that: (a) Black student to teacher ratios drive the overall ratio for mid-sized cities down; (b) few Black students attended school in districts outside of cities and Black educators were poorly represented in a majority of these districts; (c) Hispanic students were a more sizeable racial group in districts located in mid-size and small urban, suburban, and town settings, but Hispanic educators were sparse and more evenly spread across the settings.

Recommendations
These findings illustrate that, similar to Pennsylvania, Black or Hispanic educators are scarce or absent in most districts in Connecticut, and the largest urban districts in Connecticut employed the greatest proportion of Black or Hispanic educators to educate the greatest proportion of Black or Hispanic students. These findings add new evidence that Black or Hispanic educators are underrepresented in small urban and suburban districts when compared to mid-sized urban districts. This evidence is relevant because 29 of 106 small urban and suburban districts educated student populations with more than 30% Black or Hispanic students, making it very unlikely that students in these places are taught by or interact with a Black or Hispanic educator. Finally, the findings demonstrate that almost no Black or Hispanic teachers are employed in town and rural districts despite the fact that these districts educate Black and Hispanic students. I offer policy recommendations for state policymakers district and school administrators.
Districts with higher proportions of racial diversity should construct interview and hiring committees that are racially diverse. Districts that lack racial diversity should seek partnerships in places of worship, business, and higher education to begin determining how to invite educators of color into their school communities.
Recommendation 1: Prime the pipeline. Since 2001, over 50 teacher residency programs have been started nationally to address teacher shortages in urban and some rural districts.xx These programs capitalize on partnerships between districts and universities to recruit high-quality candidates and offer financial support in return for commitment to teaching for a certain amount of time. Teacher residencies typically train more teachers of color than other alternative or traditional preparation programs and their graduates, regardless of race, tend to teach longer than other novice teachers in the same district.xxi I recommend that the Connecticut State Department of Education implement a Connecticut teacher residency program to address inadequate supply of Black or Hispanic educators with a focus on increasing representation, especially in small urban, suburban, and rural districts.xxii The aim of any program should be to prepare approximately 35-70 Black or Hispanic educators annually, which would amount to 2 to 3% of the current Black or Hispanic workforce. Depending on the program design, the state should plan on a budget for recruitment, preparation, and support of new teachers of approximately $50,000 per teacher resident.xxiii This investment is large for the state, or individual districts to take on, but through collective action, the state, districts, and private philanthropy should ensure that a residency has permanent funds. This point is important because several districts already invest $30,000 to $100,000 annually for in-district residency programs, but these typically train only a handful of educators.xxiv
Recommendation 2: Make research accessible to employees who manage district personnel. Existing research makes a strong case that Black or Hispanic educators benefit all students, especially students of color. Some district and school leaders may not realize the extent of these benefits. In response to this, district administrators can partner with researchers to translate research into accessible language for school leaders, and help generate potential solutions in terms of hiring and supporting Black or Hispanic educators. This ensures that individuals who are responsible for managing a district’s workforce use the existing research base in service of studying and solving context-specific problems.xxv
Recommendation 3: Advertise that the district values diversity through job descriptions and other communication. Central office administrators and HR managers are responsible for signaling organizational values to potential hires. Any organization with an authentic commitment to workforce diversity should write job descriptions that communicate that the organization values diversity. Evidence from a randomized control trial of a Fortune 500 financial company showed that when recruitment messages used explicit statements about valuing racial diversity, the probability a person of color was interested in, applied and interviewed for, and received a job offer in this company significantly increased.xxvi
Recommendation 4: Ensure search, interview selection, and hire decisions involve racially and ethnically diverse individuals. Since district and school administrators have considerable autonomy in hiringxxvii, they should examine hiring practices to determine if the proportion of educators of color who apply, interview, and receive job offers is representative of the pools of applicants. This is critical because past research has shown that Black teachers have lower probabilities of being chosen for interviews and hired.xxviii Improving the hiring process has been shown to increase the probability that an individual of color receives an interview or a job offer.xxix Districts with higher proportions of racial diversity should construct interview and hiring committees that are racially diverse. Districts that lack racial diversity should seek partnerships in places of worship, business, and higher education to begin determining how to invite educators of color into their school communities. These recommendations apply not just to teacher candidates, but applicants for all educator positions, given that schools that hired a Black principal to replace a White principal increased the proportion of Black teachers hired and retained over time.xxx
Conclusion
This policy brief explored the distribution of Black or Hispanic educators across Connecticut’s school districts. Mid-sized urban districts employed Black educators at the greatest rates, and Hispanic educators at lesser rates, and small urban, suburban, town, and rural districts employed few Black or Hispanic educators. Whether these patterns are the result of individuals’ preferences, residential segregation, state-level policies (like public charter districts’ freedom to hire teachers without certification), or other factors remains an open question.xxxi Regardless, the distribution of Black or Hispanic educators across Connecticut’s districts suggests there is much to learn about why the educator labor market functions this way, if the distribution can be changed through policy, and if variation in the educator distribution correlates with differences in student outcomes. Given the benefits of diverse educators teaching diverse students, there is urgency for the state and districts to take immediate policy action to solve this problem.
Jeremy Landa is a doctoral candidate at the UConn Neag School of Education. His research focuses on state- and district-level policies and practices that affect teacher supply and employment. His dissertation examines the impact of Minority Teacher Scholarships on teacher of color supply and employment. He can be contacted at jeremy.landa@uconn.edu.
Tables
Table 1. Media Proportion of Black or Hispanic Students in Connecticut districts by urbanity
| District Urbanicity | Proportion of Student Population Identifying as Black or Hispanic | Number of Districts |
|---|---|---|
| Connecticut | 11.23% | 201 |
| Mid-sized urban | 93.81% | 21 |
| Small urban | 51.75% | 16 |
| Suburban | 11.79% | 90 |
| Town | 11.44% | 10 |
| Rural | 6.5% | 64 |
Table 2. Ratio of Black or Hispanic Students to Black or Hispanic Educators by urbanicity
| District Urbanicity | 1st percentile District | 25th percentile District | 50th percentile District | 75th percentile District | 99th percentile District |
|---|---|---|---|---|---|
| Connecticut | Undefined | 181 | 61 | 39 | 3 |
| Mid-sized urban | Undefined | 70.7 | 45.5 | 38.1 | 30.3 |
| Small urban | Undefined | 123 | 67.8 | 48.5 | 7.8 |
| Suburban | Undefined | 120.3 | 63.5 | 63.5 | 10 |
| Town | Undefined | Undefined | 56.3 | 53 | 20 |
| Rural | Undefined | Undefined | 188.5 | 26.4 | 3 |
Figures
CEPA is a research center based at the Neag School that seeks to inform educational leaders and policymakers on issues related to the development, implementation, and consequences of education policies. Learn more about CEPA at cepa.uconn.edu. Access the original PDF of this issue brief (including all references).
Related Stories:
 Twitter
 LinkedIn